The map goes red, you send two trucks, and the stones were soft or the path missed by half a mile. We read the hail grid at half a mile instead of seven, work out the towns and the square miles, and email it to you the morning it lands.
Free to use. No account.
The alerts from a couple of days back, published once their head start is spent. Check them against what you already know happened; that's what this board is for. Today's storms are in subscriber inboxes right now.
All of it's free and there's no account. Same data as JSON if you'd rather pull it into your own tools.
Soft hail
You've had this day. The map goes red, you send two crews, and the stones turn out to be soft. Graupel can read two inches on radar and still bounce off a shingle, because radar can size a stone but it can't tell you how hard one is.
So look at the second line on every row above. If somebody stood in that storm and measured a stone, we print what they got next to what the radar said. Some rows have it and some don't.
We're also saving something nobody else is. The radar layers that show how dense a stone was only exist while the storm is on top of you, and no archive keeps them. We write them down every half hour, every storm. That's the file that eventually tells you which storms were soft.
Somebody measured a stone here
Nobody has measured one here
A blank row means nobody was standing there, not that nothing fell. Reports follow people around, and farmland doesn't file any.
One storm, checked
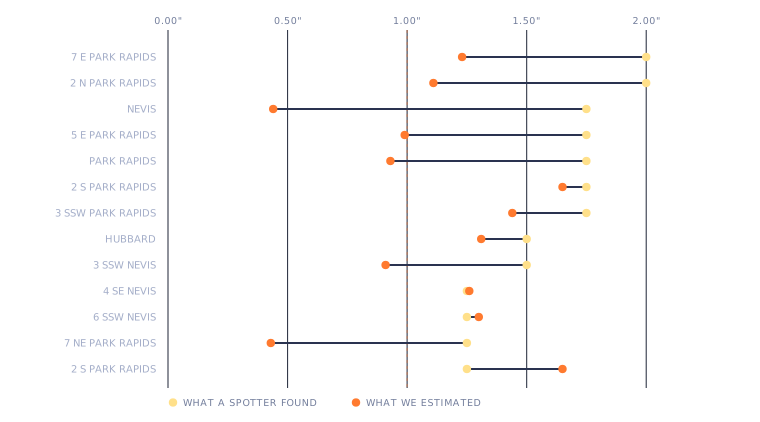
Park Rapids, Minnesota, August 7. Every stone the NWS spotters measured that night, drawn against what our grid said for the same spot. Yellow is what a person found; orange is what we estimated.
We ran under the spotters in 10 of the 13, and twice we weren't close. Radar sizes a stone; it can't weigh one. On this night it mostly erred low.
We publish this because you should mark us the same way: put in a town you already know and see how we read against your own memory of it.
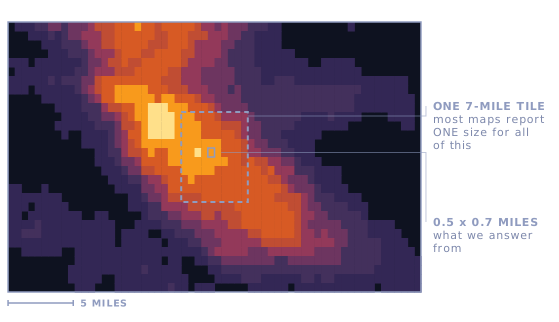
Everything inside that dashed box gets reported as one hail size. The box is about seven miles across, and it's what you're looking at when a swath map turns a county red.
Inside it, this storm ran everything from marble to baseball. Whole blocks got nothing while blocks a mile over took stones that break things. One number for the whole box can't tell you which is which.
The board up top works off the small squares, not the box.
This is the alert
We built this one a minute ago, off the storms on the board above.
Roof Watch
Everything above is free and it's staying free. Roof Watch is the automated layer: upload up to 5,000 properties once, and each one is checked for hail, damaging wind, tornado and tropical-cyclone evidence twice an hour while your laptop is closed.
One digest names the properties that changed and the evidence behind each one: the 1 km hail cell, an NWS warning polygon, or a nearby NWS storm report. Delivered events are deduplicated, and one failed source never becomes a false clean result. Regional ZIP/radius alerts are included.
Season runs about seven months. Seven months at $49 is $343, so the year costs you six dollars more than the season and you're covered for the other five. Either way it's less than one crew-day you shouldn't have spent.
See exactly how the watch works. Import, export, thresholds, billing and cancellation are all self-serve through a private email link. Nothing here needs a phone call.
HailTrace runs $999–$1,999 a year and Interactive Hail Maps won't quote you at all without a call. Here's what you get, and what we don't do.
Put in a town, a ZIP, or a full street address if you want it tight. Somewhere you already know what was on those roofs. The best test is a storm that looked great on somebody else's map and turned out to be nothing. Do four or five of those and you'll have a fair idea whether we're worth anything to you.
Or try .
Questions
The board at the top of this page. It shows every storm in the country from the last 24 hours that put down at least ten square miles of quarter-size hail, biggest first. Each row gives you the nearest towns, how many square miles got hit, the largest stone the radar saw, and whether anyone standing there measured one. It refreshes every half hour and there's no account to make.
We start the board at a one-inch radar estimate. That is the line where a crew should start paying attention, not proof that a roof is damaged. Roof age, material, wind, and the conditions at that building still matter. The map tells you where to look first. The inspection tells you what happened.
No, and be careful with anything that tells you it does. Radar can estimate how big a stone was. It can't tell you how hard it was, and soft hail reads large on radar and then bounces off a shingle. A hail map tells you where to look first. Somebody still has to get up there.
Usually it's how fine a grid they're working off. A lot of maps report one hail size for a square about seven miles across, so one number gets stretched over everything inside it. We read NOAA's grid at about half a mile. Inside one of those seven mile squares a storm can run anywhere from marble to baseball, which is how two maps end up telling you different things about the same street.
It stands for Maximum Estimated Size of Hail, and it's NOAA's radar estimate of the biggest stone a storm could have produced at a given spot. NOAA says plainly that it isn't the same thing as a stone somebody picked up and measured, which is why we put the ground reports next to it. The data is public and free, and our API doesn't need a key.
The board, address lookups, state pages, bulk history and API are free. Roof Watch is $49 a month or $349 a year because it stores your deliberate property list, checks multiple roof-event feeds every 30 minutes, deduplicates evidence and emails what changed. Cancel in the private billing portal. No sales call.
Storms don't wait for you to remember four feeds. Upload the properties you already own permission to contact or inspect, and Roof Watch emails the ones with new hail, damaging-wind, tornado or tropical-cyclone evidence. $349 for the year, or $49 a month.
Not ready? Watch the free board for a week and count how many storms cross your working area. The board stays free either way, and it always will.